NG Trace Корпоративна Система за Сигурност
Въведение:
NG Trace е модерна система за информационна сигурност с гъвкава и многослойна архитектура, проектирана от началото с идеите за скалируемост и достъпност за потребителя. It works in a way very similar to Wireshark and other network traffic sniffers, but is much more user friendly and displays the captured data in a way that makes it easy to understand and reconstruct the users' network activities as they were performed. It organizes and stores the captured data in both relational and filesystem based databases in a way that makes its searching and browsing easy and efficient. It has an intuitive, user-friendly web interface with lots of functionalities. It can apply both a set of predefined rules for following suspicious users' behaviour and it can accept new targets of interest defined by newly inserted rulesets. These rule sets define the network traffic that is of interest to the system's administrator and so, if connections that match the conditions appear in the perimeter, NG Trace records these sessions. It follows self defined heuristics for raising awareness of even slightest possibility of risk so even without new rules it can handle most of the vulnerable situations within the perimeter of the protected network. The core of the system is fully integrated with tools that monitor the network on the deepest level possible without making it necessary for the administrator to get into system specific knowledge – because of the comprehensive and fully intuitive UI.
NG Trace is an invaluable tool for IT security professionals because it can help them monitor users network activities, fight taking confidential information outside of the organization, keep an eye on virus & work network activities, meet the requirements of PCI DSS or other security standards and best practices and many others.
Discover NG Trace today and solve the future's security challenges now!
Main features:
The main features of NG Trace include:
Support for capturing, parsing and dissecting at the application protocol level the following protocols:
- HTTP - NG Trace captures and stores for later review all web pages viewed by the users in the perimeter and the files downloaded via HTTP
- Instant messengers - NG Trace can process many instant messaging protocols like: IRC, ICQ, AIM and others. The system can capture not only the conversations carried out, but also any files that have been exchanged
- E-mail - all major e-mail protocols are supported by NG Trace: POP3, IMAP, SMTP. The system captures and displays in an user friendly fasion both sent and received e-mail messages, with any attached files, embedded images etc
- File sharing - supported protocols for file exchange include: FTP, MS Windows shares, the UNIX standard Network File System (NFS), WebDAV and Bittorrent
- ICMP - the Internet Controll Message Protocol is also supported: NG Trace can help you diagnoze problems within the network by checking the ping, host / nework unreachable and other controll messages
- Others: While the above list of supported protocols is not exhaustive, it's worth saying here that the system's robust design allows easy extension through development of new protocol dissector plugins and new ones are constantly being developed
NG Trace stores the captured network traffic data in two main types of databases:
- A relational PostgreSQL database for the meta-data and simpler sessions
- A file-system based database, which exports a RESTful service for storing and fetching files. This DB / service is used to store e-mail messages' text and attachments, downloaded or uploaded files and other BLOBs (Binary Large OBject)
The system is designed with scalability in mind from the bottom up; that's why it has the following two categories of databases and can work with more than one database server at any given time:
- Recent DB (relational and file-system) for storing recent events and sessions
- Stored DB (relational and file-system) for keeping data for long periods of time
- Index DB for indexing the information in Stored DB for quick searching in a large session database
Support for sending alerts on the event of critical security violations via e-mail or SMS
Support for archiving of old data
Information exporting functionalities
A file / BLOB caching subsystem built on top of the file-system based DB, using which NG Trace avoids downloading the same files over and over again (e.g.web page assets like images, CSS, JavaScripts etc)
A powerful web interface, which allows making reports and reviewing the users' network activities and also performing configuration and system administration tasks (from account management and starting / stopping / viewing status information of the different system components to defining customized traffic matching rules)
Built-in monitoring component which monitors the status of the different system components
Powerful and flexible engine to define the parameters of the traffic to monitor: NG Trace supports both the robust, low-level PCAP/tcpdump syntax for defining capturing rules and a flexible, higher level, application protocol specific engine to further filter the captured sessions
Product details:
NG Trace has been built with support and design for scalability and load balancing - the system can easily be configured to run on a cluster of machinges, each hosting a different NG Trace component. One can easily deploy and configure multiple sniffer kernels, DBs etc. Check the following example deployment diagram for more information: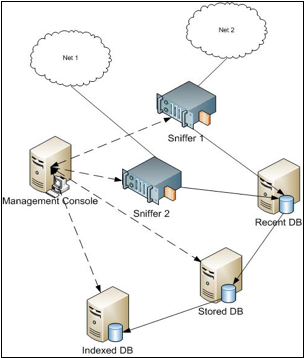
Along with the low level, IP based, PCAP traffic filtering rules, NG Trace supports a high level, application protocol specific filtering engine (e.g.STOR or GET FTP methods, server, client, URL, content type and others for HTTP etc), which makes defining precise monitoring rules possible and easy. Like the low level PCAP rules, the application protocol level ones also support composing arbitrary complex expressions using logical and precedence operators (e.g.and, or, not, '(').
The main advantage of NG Trace over similar solutions is that it keeps the gathered information in an organized and optimized database, stored in such a way that makes possible and easy the full reconstruction and replaying of past user network interactions. For example, if the security officer wants to check someone's e-mail messages, she doesn't have to filter through all other unrelated traffic (dumped in a PCAP file), using low level tools like Wireshark or TCPDump, to find the right sessions, nor does she need to decypher a bunch of hexadecimal numbers to read the message's text or attachments - it's all conveniently organized and stored for that purpose.
NG Trace is an integrated platform for network monitoring and as such provides functionalities for much more than processing the traffic. It includes a notification daemon (used to send critical event alerts), a monitor component (that can be used for monitoring and controlling the status of the whole platform - each component and server), relational and file-system based databases, helper scripts for migration of data from the recent to the stored database, archiving and indexing, installation & initialization (boot) scripts and many more.
Technical details:
In order to achive the highest possible performance and throughput, the core sniffer kernel component of NG Trace uses the new PF Ring Packet Filter Ring functionality, available in GNU / Linux kernels since version 2.6.18. PF Ring allows direct access to the network card to fascilitate high performance traffic capture, thus enabling NG Trace to handle even more throughput in large networks.
NG Trace's web console is - like all NG Systems products - implemented using the innovative Ruby On Rails web development framework and we chose the high-performance PostgreSQL RDBMS for its backend storage.
Like all traffic sniffers (and even our Corporate Call Recorder VoIP recording solution), in order to work efficiently NG Trace needs to have access to the network traffic. In older hub based networks achieving this was trivial as any node connected to the hub got access to all the traffic that goes through it. Nowadays however hubs are a thing of the past and most organizations use switches instead, because of their numerous advantages (no collisions etc). Switches don't broadcast the network traffic to all connected nodes, but instead build a virtual circuit between communicating peers and tunnel the traffic only between them. While this significantly enhances network security and brings lots of benefits, it complicates the integration of traffic sniffers (like NG Trace) and other security software. With this in mind, it is of critical importance where on the network to deploy the NG Trace sniffer kernel servers, because the results you'll get and the traffic you'll capture depend on that. Fortunately most recent switches support an elegant solution to the above problem, which different vendors call with different names; popular terms include "port mirroring" and SPAN (Switched Port Analyzer, the Cisco Systems implementation). By configuring "port mirroring" or SPAN on the switch, you can tell it to make all traffic flowing via given network interfaces (or VLANs) available also on the interface that NG Trace is connected to, thus making the traffic available to the sniffer kernel.
While NG Trace can run on any recent GNU / Linux distibution, it's especially integrated with the industry's leading server disribution: Red Hat Enterprise Server versions 5.x (or its free alternative CentOS).
Links and documentation:
The Payment Card Industry Data Security Standard - PCI DSS
 council web site